
Compound Interest Calculator
Calculate how your money could grow over time with compound interest. Enter your starting investment, recurring contributions, interest rate, investment period, and compounding frequency to estimate your future balance and total interest earned.
Money Growth Over Time
YearlyWhere Your Final Balance Comes From
Final BalanceCompare Growth Rates
Scenario ComparisonAnnual Contributions vs. Interest
Annual- The entered annual rate is assumed to remain constant for the full investment period.
- Contributions are assumed to be made consistently at the selected frequency.
- Interest/returns are assumed to be fully reinvested (compounded).
- Taxes and inflation are applied only to the relevant estimated results when enabled — the core nominal future value is unaffected.
- Fees, account minimums, and market volatility are not modeled unless reflected in your chosen rate.
- Investment returns are not guaranteed; this is an educational planning estimate, not a projection of actual performance.
| Year | Starting Balance | Contributions | Interest Earned | Ending Balance |
|---|
Embed This Tool
Add this Compound Interest Calculator to your own website using the Calculante-hosted embed. Copy the code below and paste it into your page's HTML.
Powered by Calculante
What Is Compound Interest?
Compound interest is the process where interest is earned not only on your initial starting balance, but also on the accumulated interest from previous periods. This dynamic allows your money to generate "interest on interest," creating a snowball effect that can accelerate growth over time.
Starting Balance
You invest or deposit an initial amount of money into an account or financial vehicle.
Interest Is Added
Over time, your principal balance earns interest, which is then added directly to your account.
Larger Balance
Because the previously earned interest stays in the account, your total balance becomes larger.
Future Interest Grows
Subsequent interest calculations are performed on this increased total, fueling accelerated growth.
How Compound Growth Builds on Previous Earnings
The core mechanism of compound interest lies in what happens next: if that $50 of accumulated interest remains in the account, future interest earnings will be calculated using the larger $1,050 balance rather than just your original $1,000 principal. Over longer periods, this fundamental shift distinguishes compound growth from simple interest.
How Does Compound Interest Work?
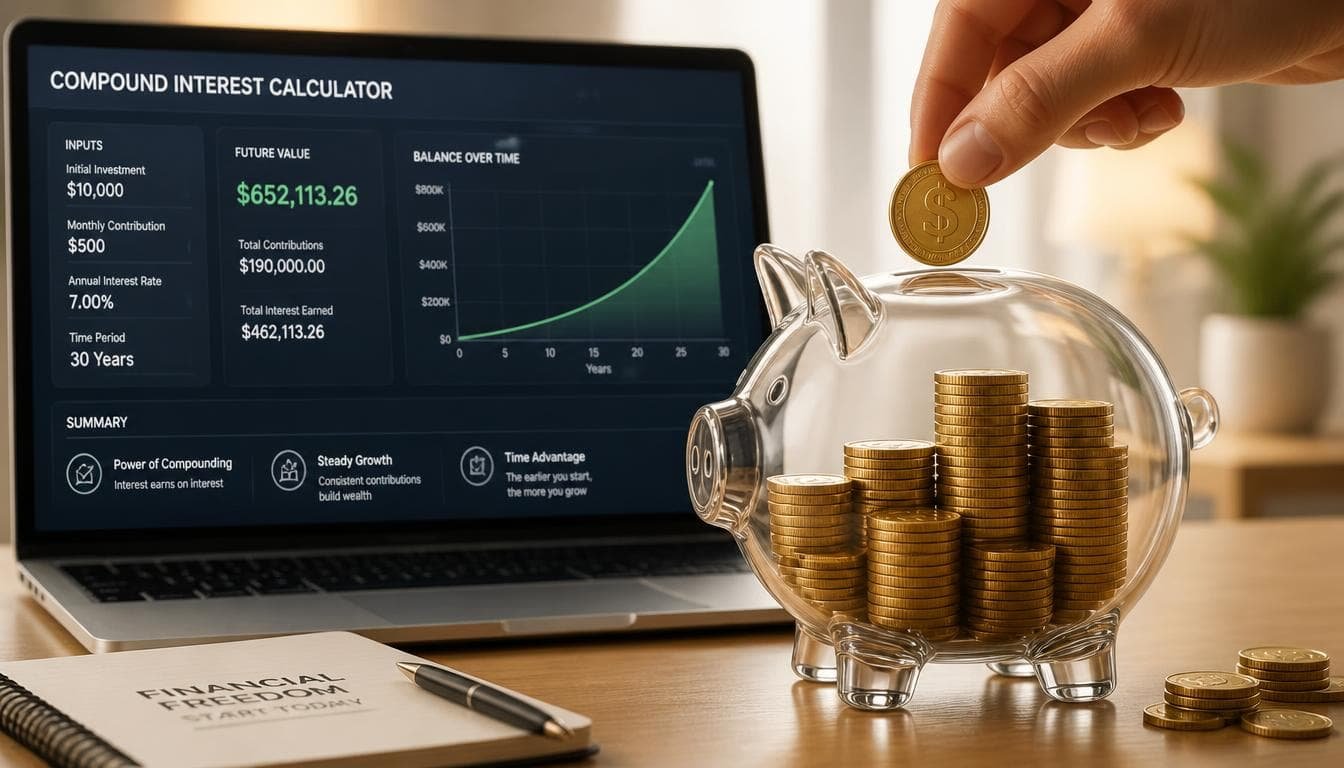
Compound growth operates through a repeating cycle where your account balance is updated with earned interest, which then becomes the new basis for subsequent calculations, subject to the specific terms of the financial product.
The Compounding Cycle
Starting Balance
Each period begins with a baseline balance consisting of your initial principal plus any previously credited growth.
Interest Is Determined
The applicable rate and account terms are used to compute the specific interest amount earned for that period.
Interest Is Credited
When interest is officially credited to your account according to its schedule, the total balance increases.
The Balance Is Updated
The account reflects the newly credited funds, establishing a larger total figure for tracking.
The Cycle Repeats
The next compounding period commences using this updated balance, carrying the process forward.
Tracking Balance Progression Over Time
To observe this mechanical sequence, consider an account with a $2,000.00 starting balance earning a 4% annual interest rate with annual compounding and no deposits or withdrawals:
Why Can the Interest Amount Increase?
When the balance used for a later interest calculation is larger, the dollar amount of interest can also be larger even when the stated interest rate has not changed. The original balance does not simply keep earning the exact same dollar amount of interest forever. Because credited interest becomes part of the updated balance, the figure used in subsequent calculations shifts upward.
Note on real-world factors: Actual financial outcomes depend on product terms. Interest rates can fluctuate, compounding schedules vary, deposits and withdrawals alter the principal base, and account fees can reduce overall balances.
Using a compound interest calculator can help organize financial projections and compare potential long-term growth scenarios, but a digital tool cannot predict market volatility or guarantee exact returns. Always combine online estimates with personalized financial planning and professional advice.
Compound Interest Formula: How to Calculate It
You can calculate compound interest by applying the standard mathematical equation A = P × (1 + r ÷ n)nt. This formula determines the future value of an initial principal by factoring in the stated annual interest rate, how often interest compounds per year, and the total duration of time.
Use this formula to project the exact future value of a starting financial amount when your annual interest rate, compounding schedule, and time horizon remain constant.
What Each Variable Means
Future Value
The final projected amount at the end of the selected time period, including accumulated interest.
Principal
The starting amount of money deposited or invested before compound growth takes effect.
Annual Rate
The yearly interest rate expressed as a decimal (for instance, 6% is written as 0.06 in calculations).
Compounding Frequency
The number of times per year that interest is compounded and added to the account balance.
Time in Years
The total duration that the principal remains subject to compound interest, measured in complete years.
Step-by-Step Calculation Walkthrough
Consider a starting principal of $5,000 earning an annual interest rate of 6% compounded annually over a period of 10 years, assuming no deposits, withdrawals, taxes, or fees.
How the Compounding Frequency (n) Changes
The variable n alters how many compounding periods occur within a single year. Below are standard values used when applying the formula:
| Compounding Schedule | Value of (n) | Example Expression Segment (r ÷ n) |
|---|---|---|
| Annual | 1 | 0.06 ÷ 1 |
| Semiannual | 2 | 0.06 ÷ 2 |
| Quarterly | 4 | 0.06 ÷ 4 |
| Monthly | 12 | 0.06 ÷ 12 → A = 5,000 × (1 + 0.06 ÷ 12)(12 × 10) |
| Daily | 365 | 0.06 ÷ 365 |
Formula Scope and Real-World Modeling
The standard compound interest formula provides a precise mathematical foundation for analyzing baseline growth under static assumptions. However, real-world financial planning often involves recurring deposits, variable rates, taxation, and administrative fees that require expanded projections or specialized digital modeling tools.
A reliable compound interest calculator simplifies complex mathematical formulas, allowing you to easily project how regular monthly contributions and compounding periods impact your overall wealth accumulation over time.
Ready to Project Your Investment Growth?
Use the compound interest calculator to estimate long-term returns, factor in regular monthly contributions, and discover how compounding can accelerate your financial goals.
Calculate Your Compound InterestCompound Interest With Monthly Contributions
Compound interest with monthly contributions accelerates wealth accumulation by combining a growing principal balance, regular monthly deposits, and ongoing compound growth over time under a constant annual rate.
Starting Balance
An initial deposit gives the account a starting amount, while future contributions add additional principal over time.
Monthly Contribution
A recurring monthly deposit increases the amount of money actively invested or saved on a predictable schedule.
Time to Grow
Earlier contributions generally have more time to potentially earn returns than later contributions in the schedule.
Compounding Effect
As the account balance grows, future growth can be calculated on a larger balance, assuming terms remain unchanged.
Step-by-Step Monthly Accumulation
Regular Contribution Future Value Formula
FV = PMT × [((1 + r ÷ n)(nt) − 1) ÷ (r ÷ n)]
Where FV is future value of recurring contributions, PMT is the contribution amount per period, r is the annual interest rate, n is compounding periods per year, and t is years. Note that monthly contributions (how often money is added) and monthly compounding (how often interest is calculated) are two distinct parameters that work together.
20-Year Monthly Investment Walkthrough
Consider a mathematical illustration assuming a starting balance of $5,000, a monthly contribution of $300, a constant annual interest rate of 7% compounded monthly, and an investment period of 20 years with no taxes, fees, or withdrawals.
Does It Matter When You Make Each Monthly Contribution?
The exact point within a month when money is deposited can create subtle variations in long-term projections due to compounding schedules.
Beginning of Month Contributions
- Money enters the account earlier in the cycle.
- Allows slightly more time to potentially compound.
- Mathematically yields a marginally higher ending balance under identical assumptions.
End of Month Contributions
- Money enters the account later in the cycle.
- Slightly less time to potentially compound during that initial month.
- Serves as the standard calculation convention for many future-value formulas.
Summary Takeaway
Adding regular monthly deposits transforms a static lump sum into an active accumulation strategy. By consistently feeding fresh principal into the account alongside compound growth, the final balance reflects both the diligence of the account holder and the mathematical momentum of returns over time.
By inputting your initial principal, expected rate of return, and time horizon into a compound interest calculator, you can instantly visualize how early investing and compound growth accelerate your journey toward financial independence.
How Compounding Frequency Affects Your Money
When the nominal annual rate and other assumptions are held constant, more frequent compounding generally produces a somewhat higher mathematical ending balance because interest is incorporated into the balance more frequently.
Compounding frequency refers to how often interest is calculated and added to the account during a year. To evaluate how compound interest frequency works, standard frequencies are categorized by their periods per year (represented by the letter n):
Interest compounds once each year.
Interest compounds twice each year.
Interest compounds four times each year.
Interest compounds twelve times each year.
Interest compounds approximately 365 times each year.
Worked Example: Comparing Frequencies Over 20 Years
Consider an initial investment of $10,000 earning a 6% nominal annual rate over a 20-year investment period with no additional contributions. Using the core compound interest formula A = P(1 + r/n)^(nt), let's examine how changing n affects the ending balance.
| Compounding Frequency | Periods Per Year (n) | Ending Balance | Growth Above $10,000 | Difference vs. Annual |
|---|---|---|---|---|
| Annual | 1 | $32,071.35 | $22,071.35 | Base |
| Semiannual | 2 | $32,620.38 | $22,620.38 | +$549.03 |
| Quarterly | 4 | $32,906.63 | $22,906.63 | +$835.28 |
| Monthly | 12 | $33,102.04 | $23,102.04 | +$1,030.69 |
| Daily | 365 | $33,197.90 | $23,197.90 | +$1,126.55 |
Why Does More Frequent Compounding Usually Increase the Ending Balance?
With annual compounding, interest is calculated and added to the account balance just once per year. With monthly or daily compounding, interest is incorporated into the balance much more frequently throughout the year. Once interest is added, it becomes part of the total principal base used for subsequent calculations under the applicable compounding model (the mechanism behind earning interest on interest). Consequently, under the same nominal annual rate, more frequent compounding results in a somewhat higher ending value.
Does Compounding More Often Always Make a Huge Difference?
No. Moving from annual to monthly compounding can alter the mathematical result noticeably, but moving from monthly compounding to daily compounding generally produces a much smaller additional difference under the same nominal rate and assumptions. The incremental benefit from increasing frequency rapidly hits a point of diminishing returns as compounding becomes more frequent. In practice, factors like the nominal rate, investment time horizon, starting amount, recurring contributions, taxes, fees, and withdrawals have a vastly larger overall effect on financial outcomes.
Formula Connection: The Role of n
In the compound interest formula A = P(1 + r/n)^(nt), the variable n represents the number of compounding periods per year. Altering n changes how rapidly the exponent scales over time:
- Annual: n = 1
- Semiannual: n = 2
- Quarterly: n = 4
- Monthly: n = 12
- Daily: n = 365
Nominal Rate vs. Compounding Frequency
When comparing compounding frequencies mathematically, it is vital to hold other assumptions constant—such as comparing a 6% nominal annual rate compounded annually versus a 6% nominal annual rate compounded monthly. These manual calculations differ from comparing financial products whose advertised yields are already standardized (such as APY). Always verify a product's stated nominal rate and compounding terms before drawing comparisons.
Real-World Context: Actual financial products and accounts may utilize unique compounding conventions, variable rate structures, maintenance fees, minimum balance tiers, and specialized calculation rules. Therefore, the mathematical comparisons shown in this section serve strictly as educational illustrations rather than predictions or guarantees of actual earnings.
When using a compound interest calculator, remember that compounding frequency—whether daily, monthly, or annually—directly impacts your total returns; more frequent compounding intervals allow your earnings to generate interest at a faster rate over time.
Compound Interest Frequency Explorer
See how changing the frequency of compounding can affect your projected future balance.
Calculator Inputs
Why does the balance change?
Compounding frequency tells us how often interest is added to the balance.
Annual compounding adds interest once each year. Monthly compounding adds interest 12 times each year.
Under the same stated annual rate and other assumptions, more frequent compounding can produce a somewhat higher mathematical ending balance.
Future Balance = Starting Amount × (1 + Rate ÷ Compounds) ^ Total Compounds
With monthly compounding
Visual Frequency Comparison
Monthly compounding produces approximately $1,031 more than annual compounding under these assumptions.
Daily compounding produces approximately $1,127 more than annual compounding under these assumptions.
Important Perspective: More frequent compounding can increase the mathematical result when the stated annual rate and other assumptions are the same. The additional difference between very frequent schedules, such as monthly and daily, is often relatively small.
Rate Note: Check whether a financial product shows an annual interest rate or APY before comparing accounts. They are not necessarily the same.
Embed This Tool
Add this calculator to another website using the official Calculante-hosted iframe.
Want to See How Compounding Frequency Changes Your Returns?
Use the compound interest calculator to test different compounding intervals—from daily to annually—and see how frequency alters your ultimate financial outcome.
Test Compounding Frequencies
How Time and Contributions Affect Compound Growth
Compound growth is shaped by several interacting variables, but the length of time money remains invested and the consistency of regular contributions have a profound, non-linear impact on your long-term final balance.
1. More Time
A longer investment period gives compound growth more compounding periods to build upon previous returns.
2. Larger Contributions
Adding more money actively increases the principal amount that can participate in future growth cycles.
3. Earlier Contributions
Money contributed earlier has significantly more time to compound than later additions under identical conditions.
4. Growth on Growth
Accumulated earnings stay invested to generate their own earnings, creating a compounding snowball effect.
Worked Example: The Dramatic Impact of Time
This mathematical illustration shows how an initial lump sum grows over different time horizons assuming a constant 7% annual rate, annual compounding, and no additional deposits or withdrawals. (Note: A 7% return is not guaranteed.)
| Time Horizon | Starting Amount | Investment Growth | Estimated Ending Balance |
|---|---|---|---|
| 10 years | $10,000.00 | $9,671.51 | $19,671.51 |
| 20 years | $10,000.00 | $28,696.84 | $38,696.84 |
| 30 years | $10,000.00 | $66,122.55 | $76,122.55 |
Formula reference: Future Balance = Starting Amount × (1 + Rate) ^ Years. Notice how extending the timeline from 10 to 30 years triples the duration but more than triples the investment growth because earnings generate their own returns.
How Regular Contributions Amplify Growth
While time builds momentum for your initial principal, regular deposits continuously inject fresh capital into the compounding cycle. To see how contributions change the outcome, consider a 20-year period starting with $10,000 at a 7% annual rate with annual compounding, compared against scenarios involving regular end-of-month contributions:
| Contribution Scenario | Total Contributions | Estimated Investment Growth | Estimated Final Balance |
|---|---|---|---|
| Scenario A: No additional contributions | $10,000.00 | $28,696.84 | $38,696.84 |
| Scenario B: $100 contributed per month | $34,000.00 | $54,342.12 | $88,342.12 |
| Scenario C: $300 contributed per month | $82,000.00 | $105,633.36 | $187,633.36 |
| Scenario D: $500 contributed per month | $130,000.00 | $156,924.60 | $286,924.60 |
Total Contributions = Starting Amount + (Monthly Contribution × Number of Months). Over 240 months (20 years × 12 months), regular additions scale up the total capital base significantly.
Start Earlier
Giving your money more time lets early compounding do the heavy lifting, allowing past earnings to generate subsequent returns.
Contribute More
Larger recurring contributions expand the total pool of money actively exposed to market returns over the investment duration.
Combine Both
Starting earlier while maintaining regular contributions gives both your initial balance and new deposits maximum time to grow.
Key Takeaways
- Time gives compound growth more opportunities to build and accelerate.
- Contributions increase the baseline amount of money available to compound.
- Starting earlier can matter because earlier money has a longer window to generate returns.
- Increasing contributions can substantially elevate the final balance, assuming other baseline conditions remain stable.
A compound interest calculator demonstrates that time is your greatest asset in wealth building; even small, consistent monthly contributions compound dramatically over extended decades, heavily outpacing larger investments started later in life.
Compound Interest vs. Simple Interest
Understanding the core differences between compound interest vs simple interest reveals why the choice of calculation method can dramatically alter long-term financial growth and savings balances over time.
Simple Interest
Interest is calculated exclusively from the original starting amount (principal). Previously earned interest does not become part of the base for future calculations, resulting in a more linear growth pattern when rates and principal remain constant.
Compound Interest
Interest is periodically added to the account balance, so future earnings are calculated on the accumulated total. This growth on growth allows returns to accelerate significantly over longer investment horizons.
Structural Calculation Differences
The mathematical design of each method determines how earnings accumulate. The formulas below illustrate these structures using ordinary text:
Simple Interest Earned = Starting Amount × Interest Rate × Time
Final Amount = Starting Amount + Simple Interest Earned
Future Balance = Starting Amount × (1 + Rate ÷ Compounds Per Year) ^ (Compounds Per Year × Years)
(The compound formula is shown here solely to demonstrate the structural difference between linear accumulation and compounding growth.)
Worked Example: 10-Year Comparison
Consider a $10,000 starting amount invested at a 6% annual rate for 10 years with no additional deposits or withdrawals. Here is how simple interest compares to compound interest with annual compounding:
| Method | Calculation Basis | Interest Earned | Estimated Final Amount |
|---|---|---|---|
| Simple Interest | $10,000 × 0.06 × 10 years | $6,000.00 | $16,000.00 |
| Compound Interest (Annual) | $10,000 × (1 + 0.06) ^ 10 | ≈ $7,908.48 | ≈ $17,908.48 |
Difference in final amount: Approximately $1,908.48. This educational illustration assumes a constant 6% annual rate, annual compounding, no deposits, withdrawals, taxes, or fees, and does not imply guaranteed returns.
Key Feature Comparison
| Feature | Simple Interest | Compound Interest |
|---|---|---|
| Interest calculated on | Original starting amount only | Accumulated balance (principal plus prior interest) |
| Growth pattern | Linear / constant additions over time | Accelerating / exponential over time |
| Effect of previously earned interest | None (does not generate additional interest) | Contributes to the base for future interest calculations |
| Longer investment periods | Growth scales at a steady, fixed rate | Divergence from simple interest widens over time |
| Typical calculation structure | Principal × Rate × Time | Principal × (1 + Rate / n) ^ (n × Time) |
| Potential difference over time | Modest and predictable growth increments | Potentially larger divergence as time increases |
The Effect of Time on the Gap Between Simple and Compound Growth
To see why time magnifies the difference, look at how a $10,000 principal at a 6% annual rate diverges across 5, 10, and 20 years with no additional contributions:
| Time Horizon | Simple Interest Final Amount | Compound Interest Final Amount | Approximate Difference |
|---|---|---|---|
| 5 Years | $13,000.00 | $13,382.26 | $382.26 |
| 10 Years | $16,000.00 | $17,908.48 | $1,908.48 |
| 20 Years | $22,000.00 | $32,071.35 | $10,071.35 |
As the timeline stretches from 5 to 20 years, compound growth includes previously accumulated interest in future calculations, causing the final balance gap to expand substantially.
When You May See Each Type
Simple interest is commonly encountered in specific financial contexts where interest is calculated directly from a principal amount over a specified period. Conversely, compound interest is standard across many savings accounts, long-term investments, and borrowing agreements where accumulated interest continuously integrates into the balance. Actual financial products may also involve additional terms, fees, contribution rules, or rate modifications.
Key Takeaway
- Simple interest applies the interest rate strictly to the original starting amount.
- Compound interest applies future interest to a balance that includes prior accumulated interest.
- The financial difference between the two methods becomes larger as the investment time period increases.
- The final outcome always depends on the exact rate, time horizon, compounding frequency, and account conditions.
Using a compound interest calculator highlights the fundamental difference between simple and compound growth: while simple interest only accrues on your initial principal, compound interest calculates returns on both your principal and previously earned interest, accelerating total growth over time.
Compound Interest vs. Simple Interest Calculator
Compare how simple and compound interest can affect your final balance.
Add this calculator to your website
Use the official Calculante-hosted iframe to embed this calculator.
Enter Your Numbers
Your Comparison
Interest Earned Comparison
| Calculation | Interest Earned | Final Amount |
|---|---|---|
| Simple Interest | $6,000.00 | $16,000.00 |
| Compound Interest | $7,908.48 | $17,908.48 |
| Additional Compound Growth | $1,908.48 | $1,908.48 |
Final Amount
Curious How Compound Interest Outperforms Simple Interest?
Use the compound interest calculator to compare exponential growth against linear returns and discover the true long-term advantage of compounding.
Compare Growth With the CalculatorNominal Interest Rate vs. APY
The nominal annual interest rate is the stated annual rate before accounting for compounding within the year, whereas the Annual Percentage Yield (APY) reflects the true annualized growth including all compounding effects, making it essential for comparing different accounts accurately.
Understanding Nominal Rates and APY
A nominal annual interest rate provides the baseline stated percentage on a deposit or loan before accounting for intra-year compounding frequencies. For instance, a savings account advertising a 6% annual interest rate has a nominal rate of 6%, but the actual annual growth will vary depending on how frequently interest is calculated and added to the balance.
Annual Percentage Yield (APY) accounts for this compounding schedule over a full 12-month period. Because compounding allows interest to earn additional interest, the APY is generally higher than the nominal rate when interest compounds more than once per year. This standardization provides consumers with a clear, uniform way to evaluate financial products with differing compounding terms.
Nominal Interest Rate
• Stated annual rate without intra-year compounding adjustments.
• Does not fully reflect how often interest builds within the year.
• Commonly shown in standard account or loan disclosures.
APY (Annual Percentage Yield)
• Reflects the total annualized effect of compounding over one year.
• Standardizes earnings for easier account comparisons.
• Higher than the nominal rate when compounding occurs more than annually.
Worked Example: Converting a Nominal Rate to APY
Consider a $10,000 starting amount with a nominal annual interest rate of 6% compounded monthly (12 compounding periods per year). Using plain text formulas, we can determine the resulting APY:
APY = (1 + Annual Rate ÷ Number of Compounding Periods) ^ Number of Compounding Periods − 1
APY = (1 + 0.06 ÷ 12) ^ 12 − 1
APY = (1 + 0.005) ^ 12 − 1 ≈ 1.061677 − 1 ≈ 6.17%
A 6% nominal rate compounded monthly produces an APY of approximately 6.17%. This illustration assumes a constant rate, regular monthly compounding, and no account-specific fees or balance modifications. It does not represent a guaranteed return.
How Compounding Frequency Changes APY
When a financial institution compounds interest more frequently—such as semiannually, quarterly, monthly, or daily—the effective annual yield increases even though the nominal rate remains unchanged. The table below illustrates how different compounding schedules affect the APY for a constant 6% nominal annual rate:
| Compounding Schedule | Periods Per Year (n) | Nominal Annual Rate | Approximate APY |
|---|---|---|---|
| Annual | 1 | 6.00% | 6.00% |
| Semiannual | 2 | 6.00% | 6.09% |
| Quarterly | 4 | 6.00% | 6.14% |
| Monthly | 12 | 6.00% | 6.17% |
| Daily | 365 | 6.00% | 6.18% |
As compounding frequency increases from annual to daily, the APY grows because interest is reinvested more frequently throughout the year.
Understanding Advertised Rates
The nominal rate is useful for identifying the baseline interest rate quoted in contract terms and baseline agreements.
Comparing Deposit Accounts
APY provides a standardized metric to evaluate savings products with completely different compounding schedules side-by-side.
Reading Financial Disclosures
Consumers can verify how financial products calculate returns by examining both the stated nominal rate and the listed APY.
Important APY Limitations
While APY is a powerful metric for comparing accounts, it remains an annualized mathematical projection based on specific assumptions. Real-world earnings can fluctuate due to variable interest rates, changing account balances, mid-year deposits or withdrawals, applicable account fees, promotional terms, or specific balance tier requirements.
Key Takeaway
- The nominal rate tells you the stated annual interest rate before compounding adjustments.
- APY shows the annualized effect after compounding is fully incorporated into the balance.
- When comparing accounts with different compounding schedules, APY simplifies evaluation because it standardizes earnings into a single comparable figure.
- Actual results depend on account terms, rate stability, and transaction history.
When inputting data into a compound interest calculator, it is important to understand the difference between the nominal interest rate and the Annual Percentage Yield (APY); while the nominal rate ignores compounding frequency, the APY accounts for it to reveal your actual annual earnings.
Nominal Interest Rate vs. APY Calculator
See how your stated annual interest rate translates into APY when interest compounds at different frequencies.
Use the official Calculante-hosted iframe to add this calculator to another website.
<iframe src="https://calculante.com/embeds/nominal-interest-rate-vs-apy/" width="100%" height="900" style="border:0;" loading="lazy" title="Nominal Interest Rate vs. APY Calculator"></iframe>
Choose how often interest is added to the balance.
A 6.00% nominal rate becomes approximately 6.17% APY.
Because interest compounds monthly, the effective annual yield is slightly higher than the stated nominal rate. The difference becomes more noticeable as the nominal rate or compounding frequency increases.
How Compounding Changes APY
The nominal rate stays the same while the effective annual yield changes with compounding frequency.
| Frequency | Times Per Year | APY | Future Balance |
|---|
APY by Compounding Frequency
With a 6.00% nominal rate, monthly compounding produces an APY of approximately 6.17%.
Compound Interest and Inflation: What Will Your Money Be Worth?
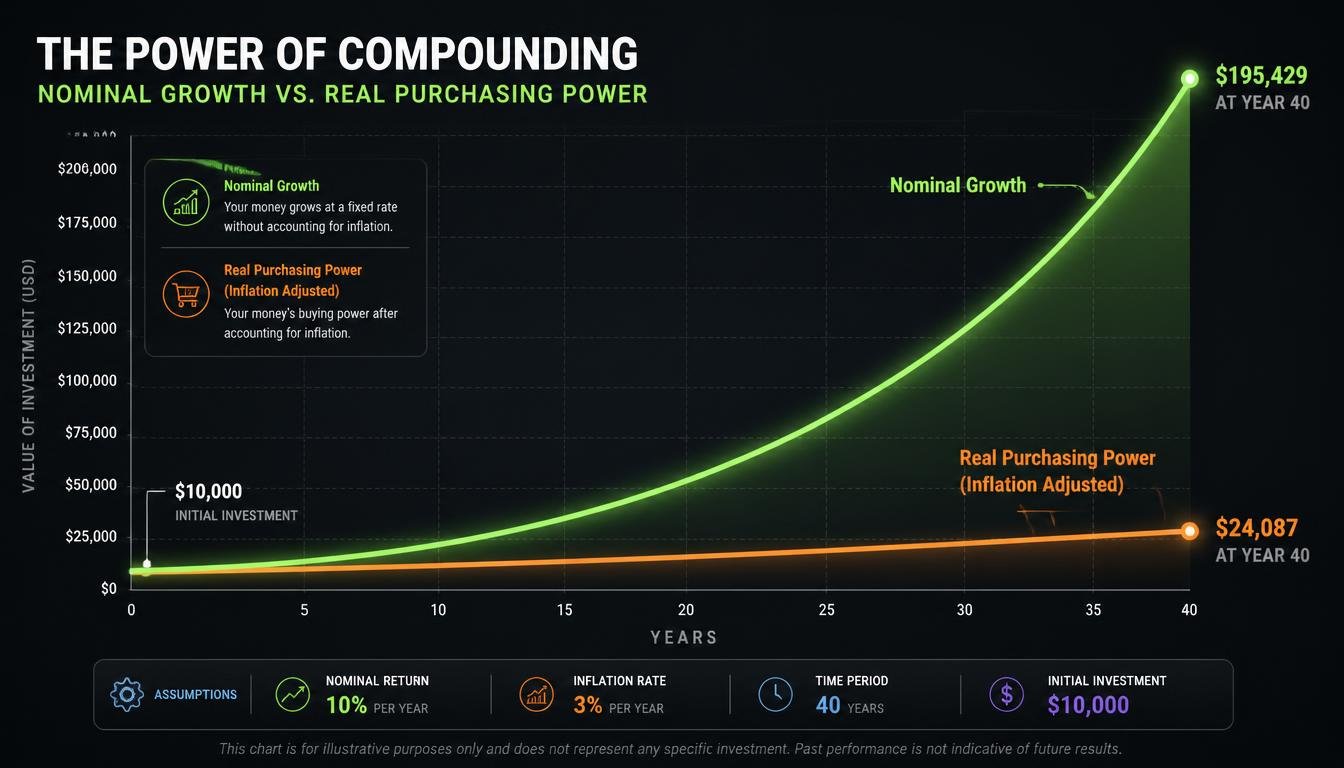
Compound interest can significantly increase the total number of dollars in an account over time, while inflation can simultaneously reduce what those future dollars are actually able to buy. Therefore, evaluating future financial health requires looking past nominal dollar balances to understand real purchasing power.
Compound Growth vs. Purchasing Power
When money grows through compound interest, your account balance expands in nominal terms. However, consumer prices also tend to rise over long periods due to inflation. If $10,000 grows to $20,000 over a specific timeframe, your nominal account balance has doubled. If the cost of goods and services has also risen substantially during that same window, that future $20,000 will not have twice the real spending power that $10,000 has today.
Distinguishing between nominal dollar accumulation and real purchasing power ensures you maintain a realistic perspective on how much future balances can accomplish.
Investment Growth
Your investment can increase in nominal dollar value over time through interest, investment returns, and ongoing compounding.
Inflation
Rising consumer prices reduce the quantity of goods and services that each individual dollar can purchase over time.
Worked Example: Nominal Value vs. Purchasing Power
Consider an initial investment of $10,000 growing at a constant 7% annual investment return, subjected to a constant 3% annual inflation rate over a 20-year period with annual compounding and no deposits or withdrawals:
Step 1: Calculate Nominal Future Value
Future Value = $10,000 × (1 + 0.07) ^ 20
Nominal Future Value ≈ $38,696.84
Step 2: Calculate Future Purchasing Power in Today's Dollars
Future Purchasing Power = $38,696.84 ÷ (1 + 0.03) ^ 20
Estimated Purchasing Power ≈ $21,437.24
In this illustration, $38,696.84 is the final nominal dollar balance in the account, while approximately $21,437.24 represents what that future balance would be able to purchase in today's dollars under the stated 3% inflation assumption. This is a mathematical demonstration, not a market forecast.
Why the Difference Matters Over Long Periods
Inflation behaves similarly to compounding because price increases compound year after year. A 3% annual inflation rate does not mean prices accumulate by a flat 60% over 20 years (3% multiplied by 20). Instead, each subsequent year's price increase builds on top of the higher prices established in the previous year. Over multi-decade periods, this compounding effect of inflation can erode a substantial portion of future purchasing power if investment returns do not outpace it.
Nominal Return vs. Real Return
When reviewing investment performance, it is vital to separate nominal returns from real returns:
- Nominal Return: The raw investment return measured in actual currency dollars before accounting for inflation.
- Real Return: The adjusted return that reflects the true growth in purchasing power after removing the impact of inflation.
A quick approximation for real return uses subtraction: a 7% investment return minus 3% inflation yields an approximate real return of 4%. For greater mathematical precision, use the exact formula: Real Return = ((1 + Investment Return) ÷ (1 + Inflation Return)) − 1. Using the same figures, Real Return = ((1 + 0.07) ÷ (1 + 0.03)) − 1, which results in an exact real return of approximately 3.88%. The approximation (4%) and precise calculation (3.88%) are close, but the precise formula accounts for the compounding interaction between returns and inflation.
Translating Future Amounts into Today's Dollars
To understand what a future balance will actually feel like in terms of modern purchasing power, you can discount the future balance using the expected inflation rate:
Today's Purchasing Power = Future Dollar Amount ÷ (1 + Inflation Rate) ^ Years
This calculation answers how much the future money will be worth in today's terms, shifting the focus from account size to actual utility.
Return Above Inflation
If investment returns consistently outpace inflation, your real purchasing power can expand over time.
Return Near Inflation
If returns match inflation, your account grows in nominal dollars while real purchasing power remains relatively stable.
Return Below Inflation
If returns lag behind inflation, your nominal balance may rise while your actual purchasing power declines.
Negative Return
If the investment loses value, inflation compounds the shortfall by simultaneously degrading purchasing power.
The Additional Impact of Taxes
In addition to inflation, taxes can further reduce the portion of investment growth available to you. Nominal returns, after-tax returns, and inflation-adjusted real returns represent entirely different metrics. Evaluating a long-term plan requires recognizing that taxes diminish the pool of money actively participating in compound growth.
Important Assumptions
Calculations involving inflation and compound interest are hypothetical models. Real-world outcomes vary because inflation rates fluctuate, investment returns are never constant, tax laws change, fees impact net balances, and individual spending habits differ from broad economic averages.
Practical Takeaway
- Compound interest illustrates how an account balance can expand in nominal dollar terms.
- Inflation clarifies what those future dollars are actually capable of buying in terms of real purchasing power.
- A rising future account balance should not automatically be treated as an equivalent increase in overall wealth or spending capability.
While a compound interest calculator shows impressive nominal growth over time, factoring in inflation is critical to understanding your true purchasing power; long-term projections should account for rising consumer prices to reveal what your future wealth will actually be worth.
Compound Interest and Inflation Calculator
See how compound growth may increase your money while inflation affects its future purchasing power.
Embed This Calculator
Add this calculator to another website using the official Calculante-hosted iframe. The calculator source remains hosted and protected by Calculante.
Enter Your Investment Details
Growth vs. Purchasing Power
Calculation Breakdown
At the selected assumptions, your investment could grow to $38,696.84, while that future amount would have purchasing power equivalent to about $21,459.05 today.
Compound Interest Examples
Practical compound interest examples make exponential growth intuitive. Because your final balance depends on your starting amount, interest rate, time horizon, and ongoing contributions, reviewing concrete scenarios clarifies how wealth multiplies. Explore these compounding illustrations to see how money behaves under different real-world conditions.
Starting With $1,000
A modest starting balance grows steadily over years as reinvested earnings generate their own returns.
Starting With $10,000
Larger baseline capital scales initial nominal dollar gains significantly faster over identical timelines.
Longer Time
Extending the duration shifts growth into an acceleration phase where accumulated interest dominates.
Adding Money
Regular periodic contributions inject fresh principal that compounds alongside existing earnings.
Example: What Can $1,000 Become?
Examine how a standard initial deposit accumulates over a 10-year horizon with annual compounding, assuming no added funds, withdrawals, taxes, or fees.
Starting Amount = $1,000
Annual Rate = 5% (0.05)
Time = 10 years
Future Value = $1,000 × (1 + 0.05) ^ 10
Final Balance ≈ $1,628.89
Interest Earned ≈ $628.89
Over 10 years at a flat 5% annual rate, the $1,000 generates $628.89 in total compound interest, bringing the total account balance to $1,628.89.
Example: How $10,000 Can Grow Over Time
Track how a $10,000 principal compounding at a flat 7% annual rate scales across multi-decade milestones:
| Time Horizon | Starting Principal | Approximate Ending Balance | Accumulated Growth |
|---|---|---|---|
| 5 Years | $10,000.00 | $14,025.52 | $4,025.52 |
| 10 Years | $10,000.00 | $19,671.51 | $9,671.51 |
| 20 Years | $10,000.00 | $38,696.84 | $28,696.84 |
| 30 Years | $10,000.00 | $76,122.55 | $66,122.55 |
Key observation: The longer money remains invested, the more dominant accumulated interest becomes compared to original contributions. Growth after 30 years ($66,122.55) vastly exceeds the initial principal.
Example: Adding $300 Every Month
Combine a baseline starting sum with consistent monthly additions compounding monthly at 7% over 20 years:
Starting Amount = $5,000
Monthly Contribution = $300 (end of each month)
Total Monthly Contributions Over 20 Years = $300 × 12 × 20 = $72,000
Total Amount Contributed ($5,000 + $72,000) = $77,000
Final Balance ≈ $162,828.33
Growth From Compound Interest ≈ $85,828.33
Out of the final $162,828.33 balance, $77,000 represents personal cash contributed, while $85,828.33 is generated purely through compound returns on principal and recurring deposits.
Example: Why the Interest Rate Matters
Compare ending balances for a $10,000 starting amount held over 20 years with annual compounding across varying rates:
| Interest Rate | Starting Amount | Time | Ending Balance | Interest Earned |
|---|---|---|---|---|
| 3% | $10,000 | 20 Years | $18,061.11 | $8,061.11 |
| 5% | $10,000 | 20 Years | $26,532.98 | $16,532.98 |
| 7% | $10,000 | 20 Years | $38,696.84 | $28,696.84 |
| 9% | $10,000 | 20 Years | $56,044.11 | $46,044.11 |
Even small percentage differences compound into massive dollar divergence over two decades. Moving from 5% to 9% doubles the final outcome tier.
Rule of 72: A Quick Estimate for Doubling Your Money
The Rule of 72 is a mental-math shortcut to estimate approximately how many years it takes for an investment to double at a constant compound rate:
Years to Double ≈ 72 ÷ Annual Interest Rate
At 6% Rate
72 ÷ 6 = about 12 years to double.
At 8% Rate
72 ÷ 8 = about 9 years to double.
At 10% Rate
72 ÷ 10 = about 7.2 years to double.
This is an approximation valid for moderate interest rates and constant compounding. Actual doubling time varies with frequency and rate consistency.
Compound Interest Examples at a Glance
Quick cross-reference matrix summarizing key scenario benchmarks:
| Scenario | Starting Amount | Annual Rate | Time | Additional Contributions | Approximate Ending Balance |
|---|---|---|---|---|---|
| Small baseline 10y | $1,000 | 5% | 10 Years | None | $1,628.89 |
| Mid growth 10y | $10,000 | 7% | 10 Years | None | $19,671.51 |
| Mid growth 20y | $10,000 | 7% | 20 Years | None | $38,696.84 |
| Mid growth 30y | $10,000 | 7% | 30 Years | None | $76,122.55 |
| Monthly savings 20y | $5,000 | 7% | 20 Years | $300 / month | $162,828.33 |
Remember: These Are Illustrative Examples
All scenarios assume constant annual rates, consistent compounding schedules, zero withdrawals, zero tax friction, zero platform fees, and fixed rules. Real markets fluctuate, rates change, taxes apply, and results differ.
The Main Lesson From These Examples
Compound growth scales dramatically as timeline length increases. Starting principal, regular contributions, and rate levels interact to shape final outcomes. Use the Calculante Compound Interest Calculator above to test custom parameters for your goals.
Reviewing practical compound interest examples—such as using a compound interest calculator to model investing $5,000 at a 7% annual return over 20 or 30 years—helps illustrate the dramatic wealth-building impact of exponential growth compared to simply saving cash without returns.
Rule of 72: How to Estimate When Your Money Will Double
Discover how the Rule of 72 provides a fast, reliable mental shortcut for estimating investment doubling time and understanding exponential growth.
Quick Answer: What is the Rule of 72?
The Rule of 72 is a simple mental-math shortcut used to estimate approximately how many years it may take for money to double at a steady annual growth rate. By dividing 72 by your annual percentage rate, you instantly find the estimated doubling time. For example, at an 8% rate, 72 divided by 8 equals 9 years.
1. What Is the Rule of 72?
When tracking long-term financial growth, investors often want a quick way to gauge how fast funds accumulate. The Rule of 72 is a classic financial rule of thumb that approximates how long an asset takes to double in value without requiring complex logarithm calculations.
The foundational relationship is expressed as:
In this equation, the annual rate is entered as a whole percentage. For instance, if funds grow at 6% annually, dividing 72 by 6 yields 12 years. This approach provides an intuitive tool for assessing investment doubling time on the fly.
2. How Does the Rule of 72 Work?
The mathematical logic relies on the properties of exponential growth and natural logarithms. Because compound growth scales multiplicatively rather than linearly, dividing 72 offers a remarkably close approximation for standard interest rates ranging from 5% to 10%.
Higher Growth Rates
A higher annual growth rate accelerates asset accumulation, resulting in a significantly shorter estimated doubling time.
Lower Growth Rates
A lower annual growth rate extends the timeline, requiring more years for initial capital to multiply twofold.
3. Rule of 72 Formula
Applying the formula in practice requires only basic arithmetic steps. Anyone can evaluate a scenario within seconds:
- Identify the expected annual interest or growth rate.
- Express that rate as a whole percentage number.
- Divide 72 by that percentage figure.
- Review the resulting quotient as the approximate timeline in years.
For example, evaluating an 8% growth rate yields 72 ÷ 8 = 9 years. Starting with a principal of $5,000 means the total balance will grow to approximately $10,000 after roughly 9 years of uninterrupted compounding.
4. Rule of 72 Examples
Reviewing practical Rule of 72 examples highlights how different rates shift accumulation timelines across various starting amounts:
Example A
$1,000 at 5%
72 ÷ 5 = 14.4 years
Target: ~$2,000
Example B
$5,000 at 6%
72 ÷ 6 = 12 years
Target: ~$10,000
Example C
$10,000 at 8%
72 ÷ 8 = 9 years
Target: ~$20,000
Example D
$20,000 at 10%
72 ÷ 10 = 7.2 years
Target: ~$40,000
5. How Long Does It Take to Double Money at 5%, 6%, 7%, 8%, 9%, and 10%?
The table below outlines estimated doubling timelines across common annual percentage benchmarks:
| Annual Rate | Rule of 72 Calculation | Estimated Doubling Time |
|---|---|---|
| 5% | 72 ÷ 5 | 14.4 years |
| 6% | 72 ÷ 6 | 12 years |
| 7% | 72 ÷ 7 | ~10.3 years |
| 8% | 72 ÷ 8 | 9 years |
| 9% | 72 ÷ 9 | 8 years |
| 10% | 72 ÷ 10 | 7.2 years |
These calculations demonstrate how minor adjustments in percentage yield yield noticeable shifts in long-term wealth milestones.
6. Rule of 72 vs. Exact Compound Interest Calculation
While a money doubling calculator or advanced financial model provides precise multi-variable tracking, mental shortcuts serve distinct educational purposes. The Rule of 72 focuses exclusively on rate-based approximations.
In contrast, comprehensive compound interest calculations account for compounding frequencies (such as daily or monthly intervals), periodic deposits, and precise starting balances. Although actual figures vary slightly from mental estimates, the shortcut remains a valuable tool for rapid financial literacy assessments.
7. How the Rule of 72 Helps Estimate Investment Doubling Time
Financial planners and savers use this concept to compare hypothetical growth paths, outline long-term horizons, and explain compounding behavior to beginners. It builds an intuitive grasp of exponential expansion without getting bogged down in complex mathematics.
8. Limitations of the Rule of 72
Understanding the boundaries of this formula ensures realistic expectations:
- It is an approximation rather than an exact accounting figure.
- It assumes a completely stable annual return without market volatility.
- Precision decreases outside the 5% to 10% interest rate window.
- It omits real-world factors like taxes, management fees, and transaction costs.
- It ignores inflation, which erodes purchasing power over time.
Want to Calculate Your Own Doubling Time?
Use our Rule of 72 Calculator to model exact growth timelines, test variable annual returns, and project your financial milestones.
Open Rule of 72 CalculatorRule of 72 Calculator
Estimate how long it may take your money to double using the Rule of 72. Enter an annual interest or growth rate to get an instant doubling-time estimate. Add a starting amount to also see approximately how much money you could have after one doubling period.
Enter Your Growth Rate
The Rule of 72 uses an annual percentage rate to estimate the number of years needed for money to double.
Your Rule of 72 Estimate
Your result updates automatically as you change the values.
Estimated Time to Double
9.0 years
This is a Rule of 72 estimate, not a guaranteed result.
Annual Rate
8.0%
Starting Amount
$10,000.00
Approximate Amount After One Doubling
$20,000.00
This assumes the starting amount grows at the stated rate without withdrawals or other changes.
Calculation Breakdown
72 ÷ 8 = 9 years
At an 8% annual growth rate, the Rule of 72 estimates that your money could double in about 9 years.
What This Means
If a steady 8% annual growth rate were maintained, $10,000 could approximately become $20,000 after one estimated doubling period.
Quick Estimate
The Rule of 72 is a simple shortcut for estimating how many years it may take money to double at a steady annual rate.
Higher Rate, Faster Doubling
A higher annual growth rate produces a shorter estimated doubling period. For example, 10% gives about 7.2 years.
Remember the Limit
The Rule of 72 is an approximation. Actual results can differ because of changing returns, fees, taxes, inflation, contributions, and withdrawals.
Common Rule of 72 Estimates
| Annual Rate | Calculation | Estimated Doubling Time |
|---|---|---|
| 5% | 72 ÷ 5 | 14.4 years |
| 6% | 72 ÷ 6 | 12 years |
| 7% | 72 ÷ 7 | About 10.3 years |
| 8% | 72 ÷ 8 | 9 years |
| 9% | 72 ÷ 9 | 8 years |
| 10% | 72 ÷ 10 | 7.2 years |
These are approximate estimates using the Rule of 72. They are not forecasts of actual investment performance.
Want to add the Rule of 72 Calculator to another website?
Get the official Calculante embedPowered by Calculante
Frequently Asked Questions
Planning your savings, investments, or debt repayment involves understanding compound growth, interest rates, and compounding frequencies. Use this comprehensive FAQ guide alongside our Compound Interest Calculator to project future balances and optimize your financial planning.
No matching questions found
Try searching using different keywords like "formula", "APY", "monthly", or "inflation".
Compound interest is interest earned on both your original money and the interest that has already accumulated over previous periods. Because your balance grows over time, the amount of interest you earn can increase with each cycle.
Compound interest works through a continuous cycle where your starting balance generates interest, that interest is added to your account, and the new total becomes the baseline for calculating interest in the next period.
Compound interest calculation depends on your starting amount, the annual interest rate, the frequency of compounding per year, and the total time period. The standard computation multiplies the principal by one plus the periodic rate raised to the power of total compounding intervals.
Future Value = Starting Amount x (1 + Rate / Compounds per Year) ^ (Compounds per Year x Years). In this expression, the starting amount is your principal, the rate is your annual decimal interest rate, and years represent the duration.
Interest can compound at various frequencies, most commonly annually, semiannually, quarterly, monthly, or daily. The actual frequency is determined by the terms of the specific savings account, loan, or investment product.
Yes, when the stated annual rate and other assumptions are identical, monthly compounding produces a somewhat higher ending balance because interest is added and begins earning more interest twelve times a year rather than once.
Recurring monthly contributions add fresh capital to your balance, which then compounds alongside your existing funds. Contributions made earlier have more time to grow and accumulate earnings than contributions made later.
The time required for money to double depends on your rate and compounding terms. A common estimation tool is the Rule of 72, calculated as Years to Double approx. 72 divided by the Annual Interest Rate, though this is only an approximation.
Simple interest is calculated strictly on the original principal amount over time. Compound interest calculates earnings on the original amount plus all previously accumulated interest, leading to accelerated growth.
A nominal interest rate is the stated annual rate before accounting for compounding effects, while APY (Annual Percentage Yield) reflects the total interest earned over one year including compounding, making it useful for comparing accounts.
Inflation affects your purchasing power by increasing the cost of goods over time. While your nominal balance grows through compound interest, your real return or purchasing power grows more slowly because general price levels rise.
At 5% annual compounding over 10 years with no additional contributions, $1,000 grows to approximately $1,628.89, yielding about $628.89 in total interest under these constant assumptions.
Starting with $10,000 at 7% annual interest with annual compounding and no extra contributions, the balance grows to approx. $14,025.52 after 5 years, $19,671.51 after 10 years, $38,696.84 after 20 years, and $76,122.55 after 30 years.
Compound growth has more time to expand when funds remain invested or deposited over longer durations, assuming the rate and compounding conditions remain constant throughout the period.
Compound interest itself is merely a calculation method; whether you gain or lose value depends on the underlying product and whether the applicable rate or market performance is positive, zero, or negative.
You enter basic inputs such as your starting amount, interest rate, time period, compounding frequency, and optional recurring contributions. The calculator estimates future balances, total contributions, and growth to help you compare financial scenarios.
Our Trusted Sources
Our compound interest calculations, future value formulas, and financial growth projections are built upon verified guidelines, economic data, and methodologies from leading financial regulators, central banks, and investor education authorities.
Related Calculators
Calculate future investment growth, plan retirement savings, determine loan amortization schedules, and evaluate mortgage interest expenses with our suite of specialized financial planning tools.
Investment Calculator
Project the long-term growth of your portfolio, stock market returns, and regular contributions using advanced compounding formulas.
Launch Calculator →Retirement Calculator
Determine how much you need to save each month to reach your target retirement nest egg and maintain your lifestyle.
Launch Calculator →Loan Calculator
Calculate monthly loan payments, total interest over the life of the loan, and complete amortization schedules for personal or auto loans.
Launch Calculator →Mortgage Calculator
Estimate monthly mortgage payments including principal, interest, property taxes, homeowner's insurance, and private mortgage insurance.
Launch Calculator →